We are excited to announce the latest release of Backup My Org, version 1.4, is now available! Focused on stability, this massive new release is packed with 5 new features, 62 improvements, and 94 bug fixes designed to give you the best backup and restoration experience possible. Let’s dive into what’s new! New Features Option […]

Powering Progress: Plugging in to Esri’s 2024 ERGIS Conference
The 2024 Esri Energy Resources GIS Conference is a highly anticipated event in the energy industry. The conference—held April 24-25 at the George R. Brown Convention Center in Houston, Texas—is a unique blend of geospatial technology and energy resource management, making it a must-attend for anyone involved in the exploration, production, distribution, or consumption of […]

Q&A with GEO Jobe’s Angel Ahlstedt, Executive Assistant
GEO Jobe has been serving our clients and partners since 1999, and the key to our success is the people behind our growing company. Here is a brief Q&A with Executive Assistant Angel Ahlstedt, who joined GEO Jobe in 2023. Q: What is your job at GEO Jobe, and what does it entail? A: I […]

Dev Summit: Growing Your Network
Esri’s 2024 Dev Summit was filled with a plethora of technical sessions and networking opportunities. The social Thursday night was amazing—offering a host of fun activities, including a dodgeball tournament, arcade games, a DJ, food, drinks, and much more! Esri went all out to make sure their users had a great time. During the conference, […]
Admin Tools for ArcGIS 2.2 Out Now
GEO Jobe is excited to announce the latest update to Admin Tools, packed with a suite of new features designed to streamline your tasks and elevate your efficiency. Among the highlights of this update are several powerful additions aimed at making ArcGIS administration even easier. Join us as we delve into the exciting new features […]
Leave the Driving to GIS
Image designed by Freepik Having grown up on a healthy diet of cartoons and sci-fi shows, I have always been anxiously waiting for the things I saw on the screen or read in a book to make their way into my everyday life. The Jetsons promised flying cars with autopilot features. Many a summer Hollywood blockbuster […]
DevSummit 2024: A Curated Guide of What Not To Miss
Catch some sun while taking your GIS knowledge to the next level with advanced mapping technology and cutting-edge apps at Esri’s 19th Annual Developer Summit! On March 12-15th, DevSummit will bring together Esri’s global developer community in the beautiful Palm Springs, California. Registration DevSummit offers both in-person and virtual attendance options. Participate in various sessions […]
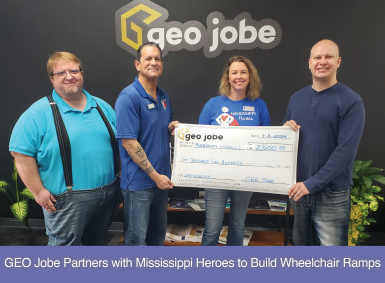
GEO Jobe Partners with Mississippi Heroes to Build Ramps for Citizens in Need
GEO Jobe CEO David Hansen (far right) and COO Daniel Menikheim (far left) present a check to MISSISSIPPI Heroes Executive Director Katherine Sutton (center right) and Board President Eric Alvarez (center left). GEO Jobe is proud to announce a new partnership with a local nonprofit to build wheelchair ramps for residents throughout Mississippi. GEO Jobe […]

Learn GIS with the Best at Esri
Further your GIS knowledge with Esri MOOCs and more! The GIS field is a vast field with multiple specializations and consistent new developments. While a GIS analyst may be specialized in one area, they may not be aware of features in another area, or even how new developments may apply to their field. One way for […]
All In On AI: Embracing a New Geospatial Alliance
Image generated by DALL-E using Microsoft’s Copilot Our world is undergoing a technological transformation as search engines on the World Wide Web have replaced our necessity for checking out encyclopedias from the local library. In fact, location has very little bearing on our accessibility to the vast expanse of digital information on the Internet today. […]